The file attached to this post is a work-in-progress. In this project, I tackle racial justice using mathematical tools in two different ways. First, develop a numerical index of racial equality that can be used to compare states using Microsoft Excel and JMP scripting. Second, I develop a unit for a college course for non-math majors whereby the students use Google Sheets to explore the connection between race and income by using US Census data for Tucson, Arizona.
Month: May 2019

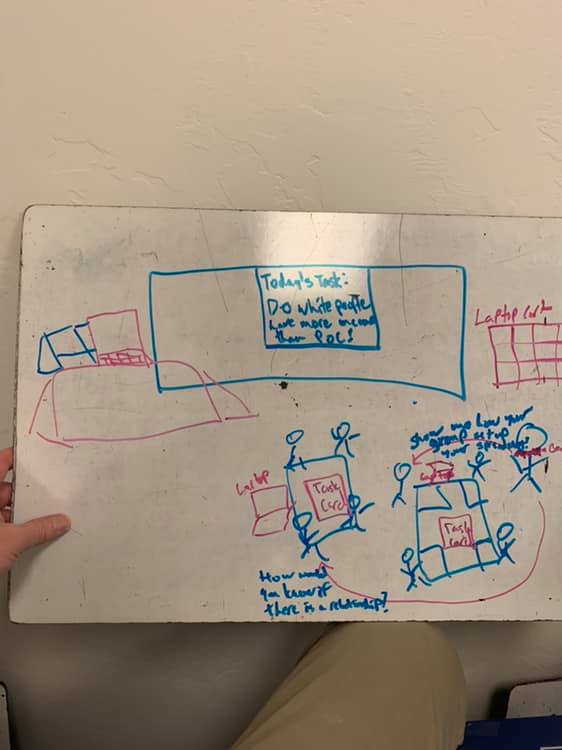
I drew a classroom where students are engaged in the task : “Do white people have more income than People of Color?” There’s a cart of laptops in the corner, a smartboard, a teacher’s desk with a computer and my Microsoft Surface next to it. Students are in groups of 4, and each group has a laptop. Me, the teacher, is larger than them and bearded, and each group has a task card. I am going around and asking questions like “How would you know if there’s a relationship?” and “Show me how your group set up your spreadsheet?”.
Based on Ohmer Milton’s book Making Sense of College Grades, I’ve put up his Learning Oriented-Grade Oriented quiz on my website. I could not find cut scores for the test, so the cut scores I used are arbitrary, and I have found it still a useful thing to use with my students when teaching study skills. You can take the test here, and feel free to send your students there:
http://jamessheldon.com/test/are-you-learning-oriented-or-grade-oriented/
Dear JamesSheldon.Com Blog Readers,
I have a secondary blog that I update quarterly. I blog with a mathematics educators’ perspective for the American Mathematical Society’s graduate student blog. You can find my blog posts on that blog here:
https://blogs.ams.org/mathgradblog/author/jsheldon/
If anyone is interested in becoming a blogger for AMS, I’d be happy to connect you. I’m also open to guest posts on the jamessheldon.com blog.
James “Mountain Shadow” Sheldon